

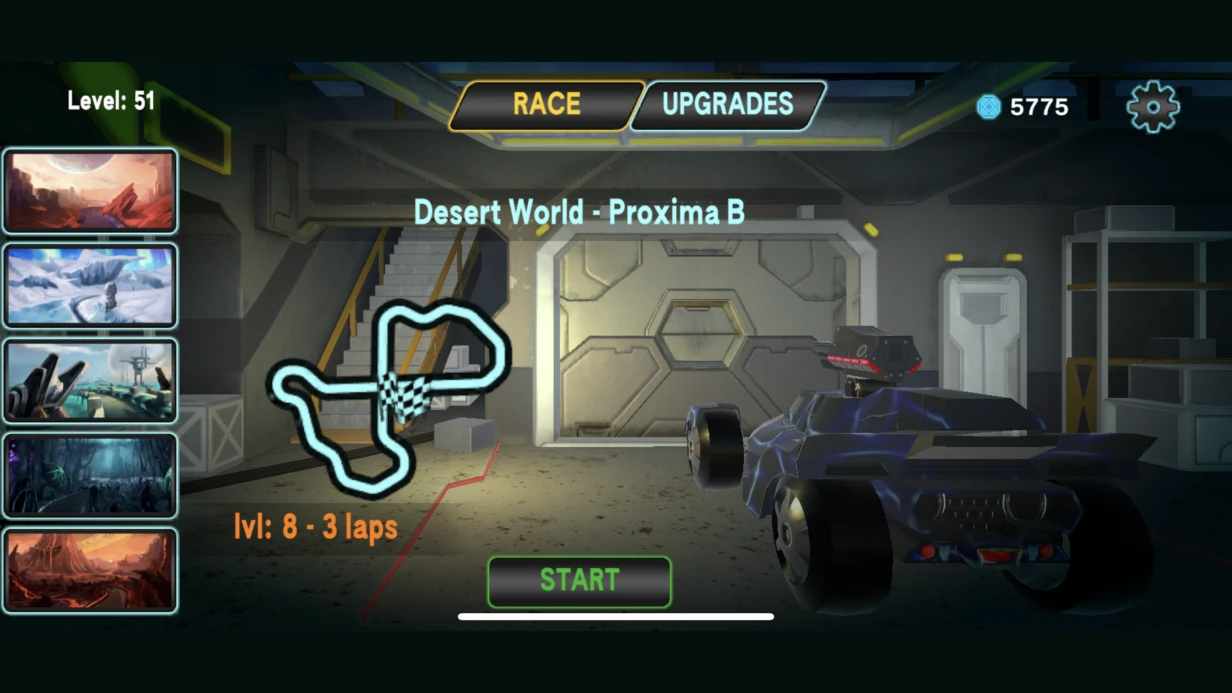

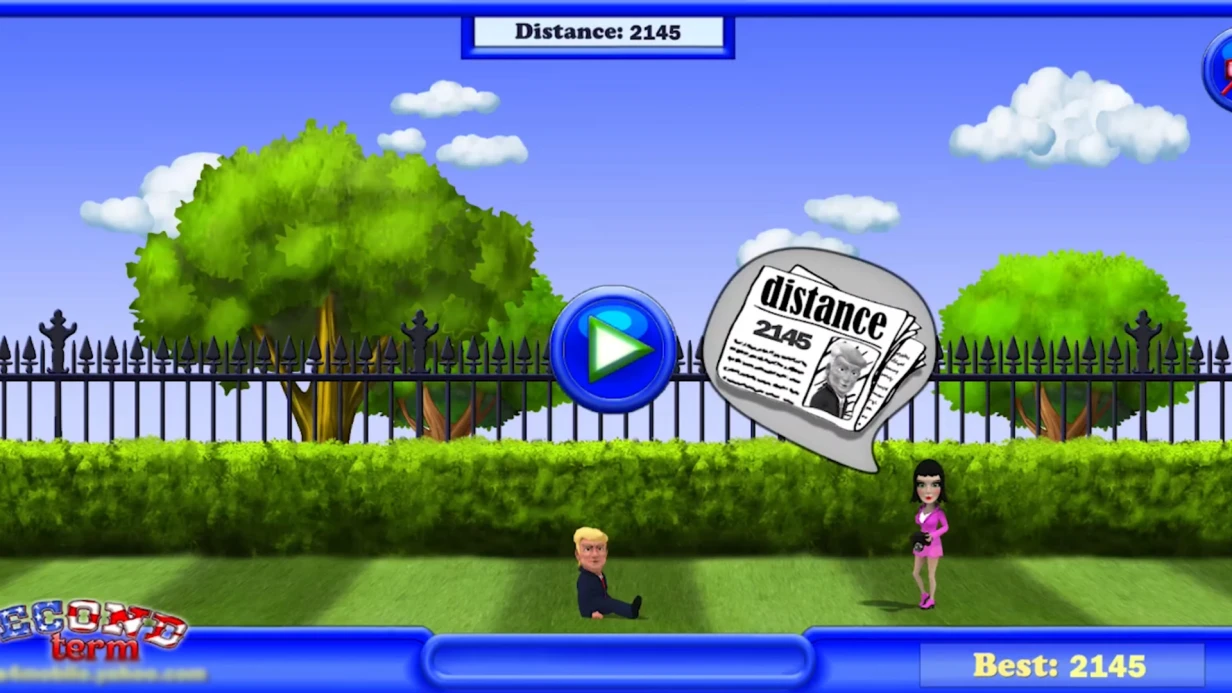
משחק שרץ ב-60 fps ב-Pixel 7 יכול לרדת ל-18 fps ב-Redmi Note 9 — וזה לא בגלל שהטלפון "חלש". זה בגלל שה-Adreno 618 וה-Mali-G52 מעבדים את אותו shader בצורה שונה, ואף אחד לא בדק את ההתנהגות על Mali לפני השחרור. אנחנו מתמודדים עם מקרים כאלה מדי יום ויודעים להפוך מצגת לתמונה חלקה. במהלך העבודה שלנו, בדקנו יותר מ-50 פרויקטים — מ-hyper-casual ועד open-world RPG. בדיקת ביצועי גרפיקה היא על הבנת הבדלי החומרה והבטחה שהמשחק לא מאבד את הקהל שלו.
מה כלול
| שלב | תוצאה |
|---|---|
| ניתוח פרויקט ואיסוף build | מטריצת מכשירים, תרחישי בדיקה |
| פרופיילינג בסיסי | זמן פריים, draw calls, overdraw, זיכרון לכל מכשיר |
| אופטימיזציה איטרטיבית | Atlas, LOD, GPU Instancing, occlusion culling, Shader LOD |
| בדיקה חוזרת | השוואת מדדים לפני/אחרי, זיהוי בעיות חדשות |
| דוח והדרכת צוות | תיעוד, לוגים, גישה לדוחות למשך חודשיים |
למה המשחק נתקע רק במכשירים עם Mali GPU?
ארכיטקטורת Mali משתמשת ב-tile-based deferred rendering, שבו overdraw והוראות shader ברמת דיוק גבוהה יכולים לגרום לירידות ביצועים. לדוגמה, דיוק mediump ב-textureCubeLod עלול לגרום ל-software fallback. אנחנו מזהים מקרים כאלה באמצעות Mali Graphics Debugger.
איפה צווארי הבקבוק האמיתיים בביצועים?
Draw calls ו-batching. 200 draw calls במכשיר נייד זה האזור האדום. ממשק משתמש דרך Canvas במצב Overlay עם מספר child canvases, שכל אחד מהם עושה override sorting, ישבור לחלוטין את כל ה-batches. התוצאה: 80 draw calls רק עבור ה-HUD, שניתן להפחית ל-5–8 עם היררכיה נכונה.
Overdraw. ב-GPUs ניידים (tile-based deferred rendering), overdraw הורג ביצועים מהר יותר מאשר במחשב שולחני. רינדור פיקסל אחד 4 פעמים ברציפות פירושו פי 4 יותר עבודה עבור ה-GPU. מערכות חלקיקים עם Additive blending, שכבות UI ללא culling, meshes שקופים — מקורות טיפוסיים. RenderDoc צובע overdraw עם מפת חום ישירות ב-viewport.
Thermal throttling. מכשירי Android בינוניים לאחר 3–5 דקות של משחק אינטנסיבי מפחיתים את תדרי ה-CPU/GPU ב-20–40% עקב התחממות יתר. לא ניתן לשחזר זאת באמולטור. לכן, בדיקת ביצועים מתמשכת נעשית רק על חומרה אמיתית, עם סשן משחק של 20 דקות לפחות.
איך להרכיב מטריצת מכשירים לבדיקה?
בדיקה על מכשיר "מייצג" אחד אינה מספיקה. מטריצה מינימלית לפרויקט נייד:
- נמוך (רצפת יעד): Qualcomm Snapdragon 460/Adreno 610, Mali-G52, 3 GB RAM.
- בינוני (קהל עיקרי): Snapdragon 700-series/Adreno 618-619, Mali-G76, 4–6 GB RAM.
- גבוה (דגל): Snapdragon 8 Gen 2, Apple A16, 8+ GB RAM.
iOS בנפרד: iPhone SE 2 (A13), iPhone 12 (A14), iPhone 14 Pro (A16) — שלושה דורות, שלוש התנהגויות Metal שונות.
למה בדיקת אמולטור לא מחליפה חומרה אמיתית?
האמולטור לא משחזר thermal throttling — הוא משתמש במשאבי המארח ללא הגבלות. יתר על כן, הוא לא מאמיר את הארכיטקטורה מבוססת ה-tile של Mali ו-PowerVR, כך שבעיות overdraw ו-shader עלולות להיעלם מעיניים. רק על מכשיר פיזי ניתן למדוד תקציב FPS בפועל, ירידות טמפרטורה והתנהגות סוללה.
כלים ומתודולוגיה
זרימת עבודה מרכזית: Unity Profiler → Frame Debugger → Memory Profiler → כלים ספציפיים לפלטפורמה.
Unity Profiler מספק פירוט שרשורי CPU וציר זמן GPU, אבל ציר הזמן של GPU לא עובד כראוי בכל המכשירים. בחלק ממכשירי Android, ADB Profiler מציג אפסים בבלוק ה-GPU. במקרים כאלה, אנו משתמשים בכלים מקוריים:
- Adreno GPU Profiler (Qualcomm): פירוט מפורט של שלבי pipeline, יעילות HSR, ספירות מחזורי shader.
- Mali Graphics Debugger (Arm): דומה עבור ארכיטקטורות Mali, בתוספת ויזואליזציה של רוחב פס.
- Xcode Instruments + Metal Debugger: עבור iOS/Metal — כלי חובה.
- RenderDoc — לכידת פריים חוצת פלטפורמות עם inspector מצב מלא לניתוח shader ו-batching.
לבדיקות אוטומטיות — Unity Performance Testing Package. מאפשר כתיבת בדיקות שמודדות מדדים (זמן פריים, הקצאות GC, draw calls) ושומרות קווי בסיס.
איך אנחנו עושים את זה
- ניתוח ראשוני: לימוד ה-build, קביעת מכשירי יעד, הסכמה על מטריצה.
- פרופיילינג בסיסי: בכל מכשיר, רישום זמן פריים, draw calls, overdraw, זיכרון.
- זיהוי צווארי בקבוק: מציאת סצנות בעייתיות (תחילת משחק, אפקטי פיצוץ, אזורים פתוחים).
- אופטימיזציה איטרטיבית: texture atlasing, קבוצות LOD, GPU Instancing, occlusion culling, Shader LOD.
- בדיקה חוזרת: אחרי כל שינוי, מדידת כל המכשירים.
- ולידציה: בדיקת ביצועים מתמשכת (20+ דקות) ומסירת דוח עם המלצות.
| היקף בדיקה | לוח זמנים משוער |
|---|---|
| פרופיילינג של סצנה אחת, 2 מכשירים | 3–5 ימים |
| פרופיילינג מלא של המשחק, מטריצה של 6 מכשירים | 2–3 שבועות |
| בדיקה + אופטימיזציה + ולידציה | 4–8 שבועות |
צרו קשר כדי לדון בפרטים ולהעריך את הפרויקט שלכם. קבלו ייעוץ ממהנדס עם ניסיון באופטימיזציה לכל GPU.